Building a Grafana Telemetry Dashboard for my Aer Lingus flight to Chicago

I hate flying long haul, and 2 months ago I was on an 8 hour flight from Dublin Airport to Chicago. With the in-flight Wi-Fi barely able to load a 500Kb web page the boredom quickly set in.
The only page I could reliably load was the in-flight captive portal, which I noticed was displaying some information on the current flight. With my curiosity getting the better of me I started investigating where the data was coming from.
Reviewing the network connections via the "Inspect" menu quickly revealed an API endpoint:
http://services.inflightpanasonic.aero/inflight/services/flightdata/v2/flightdataThat API provided a whole host of information on the current flight. Unfortunately I didn't record the whole payload, but luckily I am not the only one who has discovered this API. The payload was identical to the one shared by dshanske on GitHub:
My first thought was to display this data in my own dashboard which would show a point in time snapshot of the data. But as I reviewed the data in more detail I thought it would be cool to store it in a time-series database and then visualise it over time.
I wanted to use InfluxDB to store the data, but as I mentioned earlier, the Wi-Fi was shocking and there was no chance of me downloading Influx while in the air.
However I did have a local Docker Image on my Mac for both Prometheus and Grafana, and I also had Golang installed. While Prometheus wasn't optimal for storing all of the data available via the API, I could store most of it. I had everything I needed to build a dashboard.
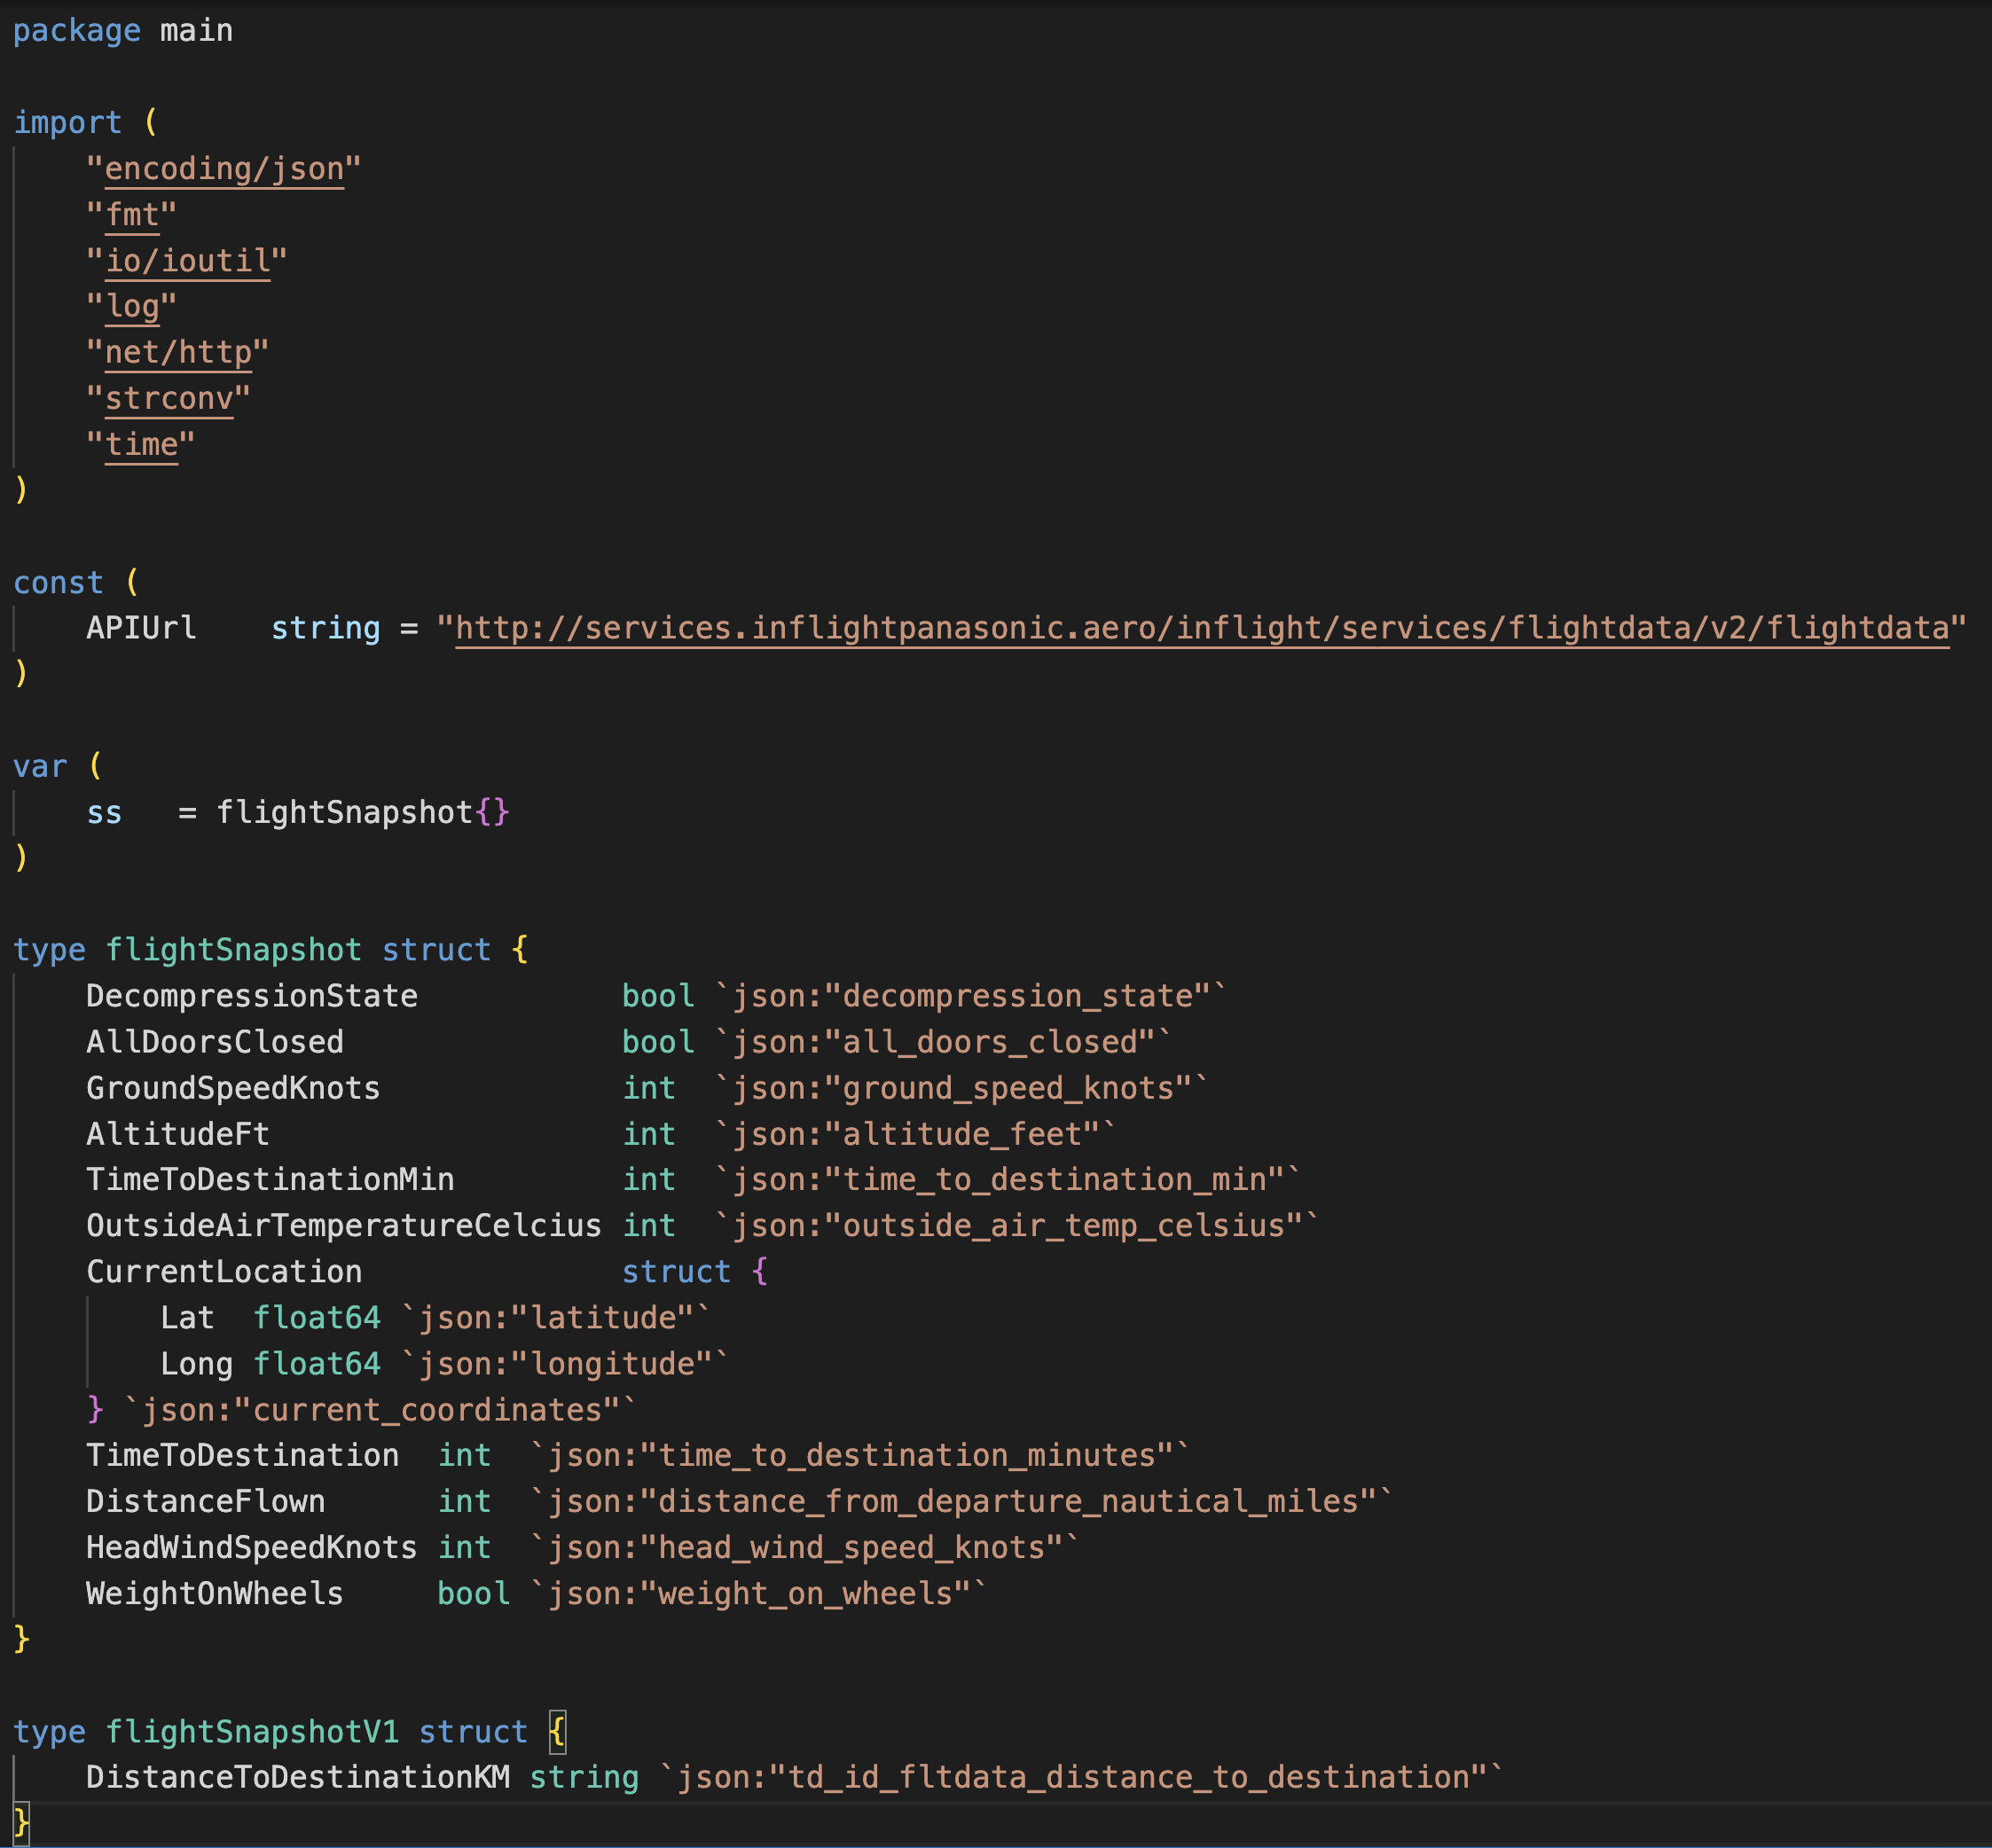
First I wrote a small Go Service that acts as a piece of middleware between Prometheus and the in-flight API.
The service exposes a /metrics endpoint that Prometheus can scrape. When Prometheus calls the /metrics endpoint the service calls the in-flight API and transforms and populates all of the data in a format Prometheus can ingest.
Once that service was written and Prometheus was configured to scrape it, all that was left to do was build out the dashboard in Grafana. After a small amount of time I had a dashboard with all of the flight information.
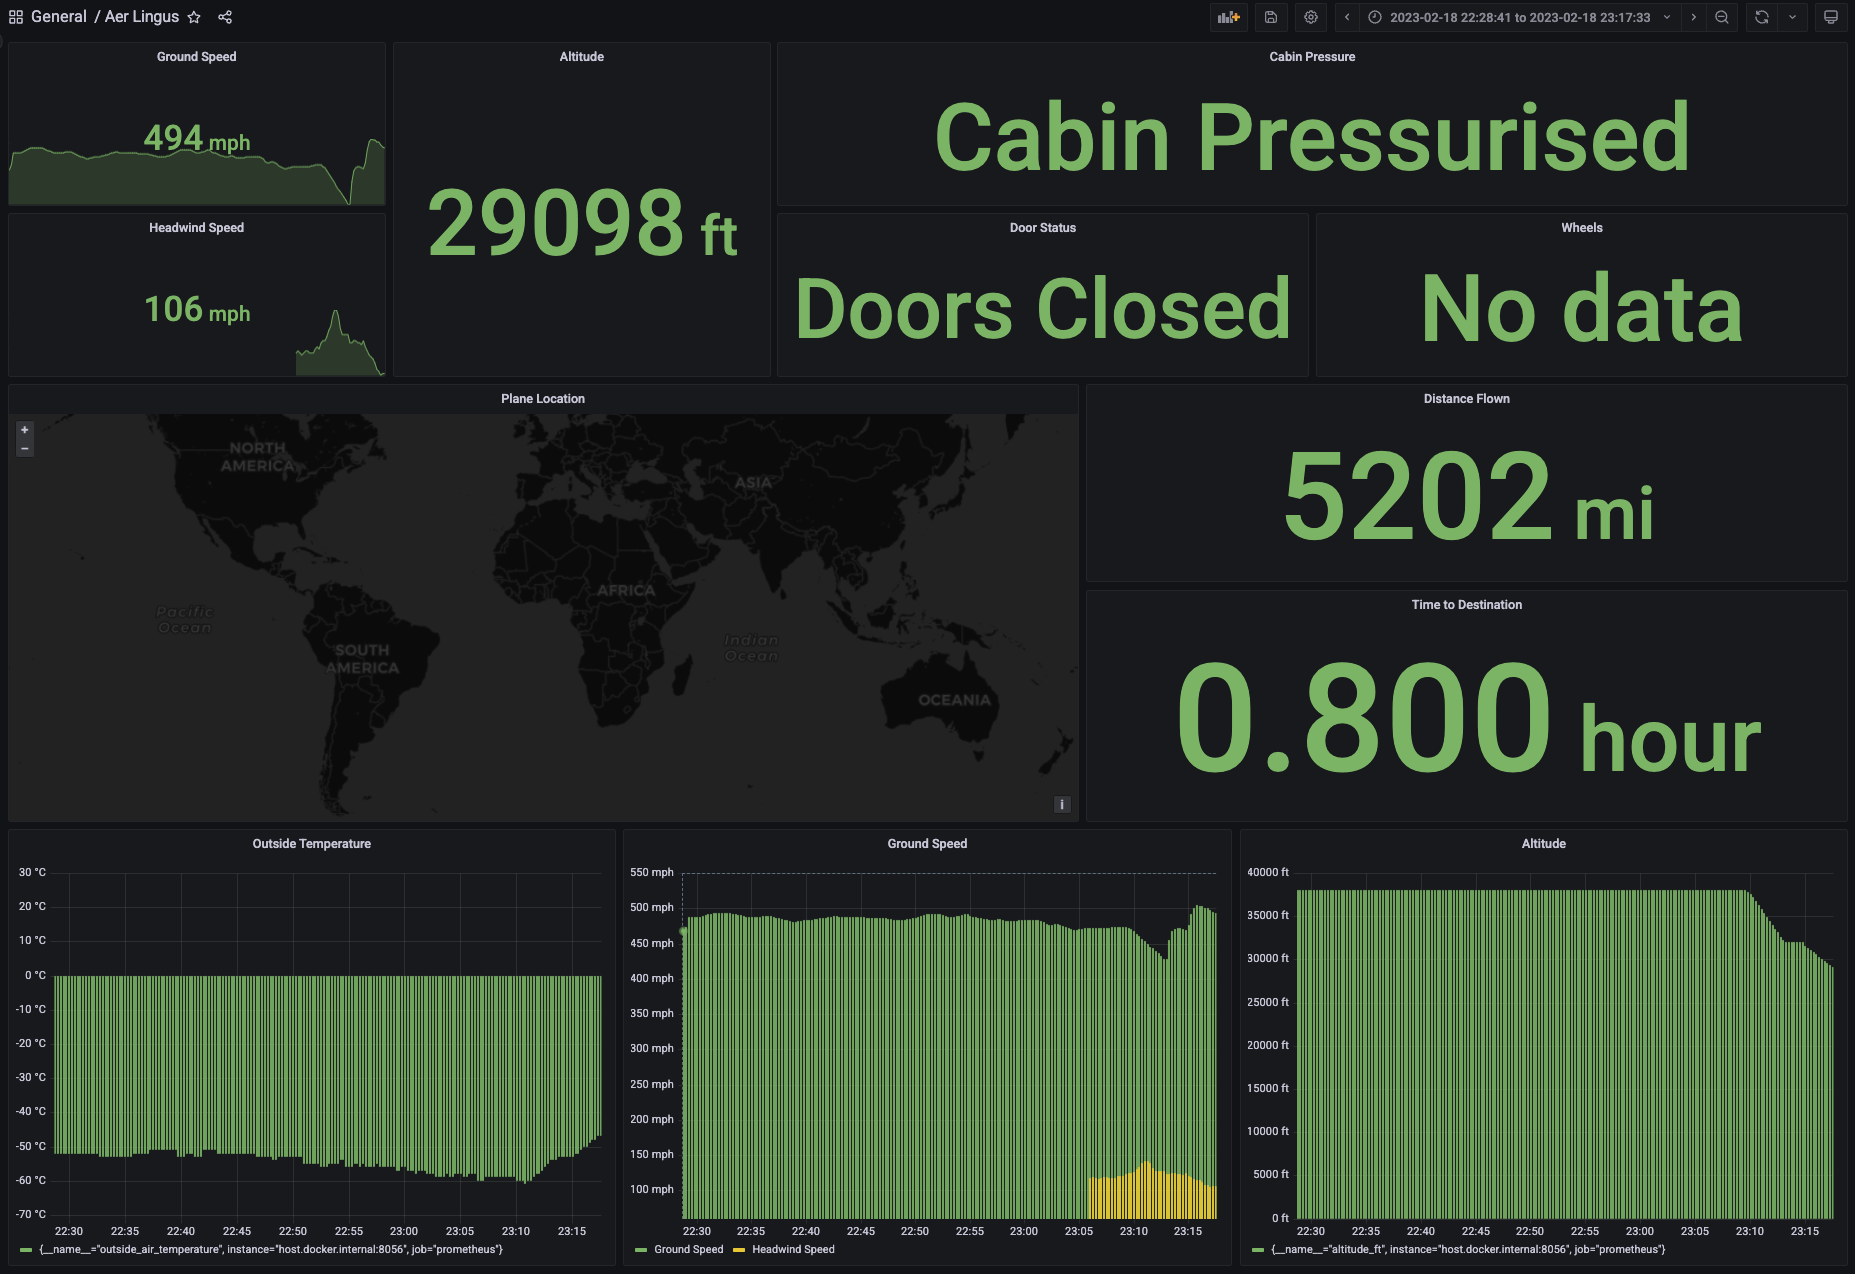
I made various tweaks over the course of the flight and killed a good number of hours. It looks like this API might be common across a number of providers so I'll be seeing if it works next time I fly long-haul.
Member discussion